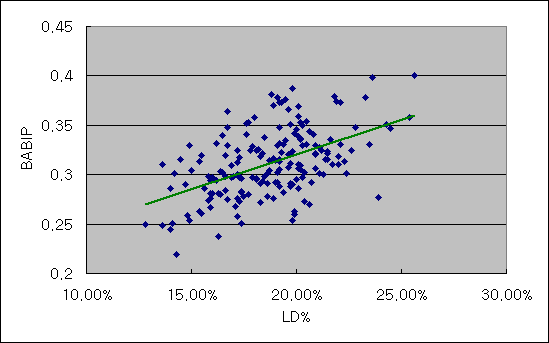
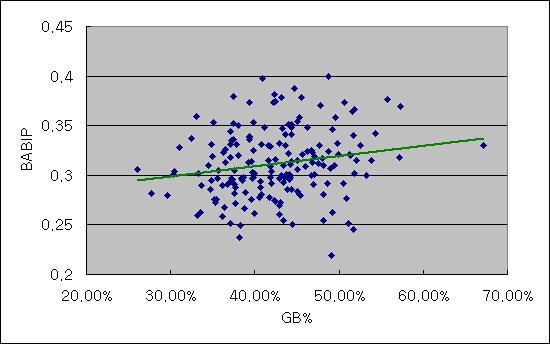
首先,我採用了178位MLB打者在8月15日前的資料,做了些simple linear regression analyses,看能否找出independent variables ( LD%、GB%、FB%)與dependent variable的關係。
從Fig.1來看,BABIP與LD%是positive correlated,換句話說,as the amount of independent variable,LD%,increases; the dependent variable,BABIP, also increases.
Fig2:GB%跟BABIP是有positive slope, 不過沒LD%那樣明顯。
Statistically,球打高的次數越頻繁,BABIP就越低,趨勢還滿顯而易見的,比想像的還大。
從數字的角度來分析,LD、GB、FB轉換成安打的機率也許比光看圖表來得精準。
| PEARSON Product (r) | LD% | GP% | FB% |
| BABIP | .512 | .191 | -.373 |
從這table來看,GP與BABIP並沒有特別引人注意的關係,換句換說,GP%的變動,並不會對BABIP有啥影響。LD%、FB%的correlation coefficient也沒強烈到能當作predictor來看待。
從以下的表格就可略之一二:
| R^2 | LD% | GP% | FB% |
| BABIP | .262 | .036 |
.139
|
"R2 is a statistic that will give some information about the goodness of fit of a model. In regression, the R2 coefficient of determination is a statistical measure of how well the regression line approximates the real data points. An R2 of 1.0 indicates that the regression line perfectly fits the data."
上述的分析都是以整體、平均的觀點來分析。接下來將以個別球員來看batted ball tendency與BABIP的因果關係...
Top 10 GB% of BABIP:
| Name | GB% | BABIP |
| Luis Castillo | 67.1% | .333 |
| Derek Jeter | 57.3% | .369 |
| Tony Pena | 57.2% | .318 |
| Ichiro Suzuki | 55.8% | .376 |
| Joe Mauer | 54.3% | .342 |
| Casey Kotchman | 53.9% | .315 |
| Shawn Green | 53.2% | .300 |
| Orlando Hudson | 52.6% | .333 |
| Mark Teahen | 51.8% | .366 |
| Juan Pierre | 51.8% | .302 |
從這table多少能看出Top10 Groundball hitters的BABIP都滿高的,棒球場上就是有些奇人異士,GB%越高,BABIP就越唬爛。
Ichiro Suzuki就是很好的例子。2004、2007年的GP%皆比其他球季來的高,在這兩球季,LD%很恰好地也同時低於20%。但有人能主張Ichiro都是靠唬爛、運氣來維持高檔的BABIP?
我的結論是以那些強者的能力跟天賦,不管用啥方式,BABIP會趨向符合自身實力的合理值。換句換說,大樣本所得到計算結果,有時很難對單一球員一概而論。
最後補上一些LD%的個人數據,不然發現結論有時會因個人假設而不同。打個比方,我假設LD%與BABIP有強烈的因果關係,挑有利於我的數據來闡述,這時得到的結果就會失真。事實上,LD%的R、R2多少說明LD%並不是很理想的BABIP estimator。
Top 10 LD% of BABIP:
| Name | LD% | BABIP |
| Chone Figgins | 25.6% | .400 |
| Michael Young | 25.4% | .358 |
| Brendan Harris | 24.5% | .347 |
| Placido Polanco | 24.3% | .351 |
| Paul Lo Duca | 23.9% | .277 |
| Jorge Posada | 23.6% | .398 |
| Todd Helton | 23.5% | .331 |
| Edgar Renteria | 23.3% | .378 |
| Delmon Young | 22.8% | .348 |
| Shannon Stewart | 22.6% | .324 |
Bottom 10 LD% of BABIP:
| Name | LD% | BABIP |
| Ray Durham | 12.8% | .250 |
| Chris Young | 13.6% | .249 |
| Gary Matthews Jr. | 13.6% | .310 |
| Nick Punto | 14.0% | .245 |
| Adrian Beltre | 14.0% | .286 |
| Brian Schneider | 14.1% | .251 |
| Aubrey Huff | 14.2% | .301 |
| Richie Sexson | 14.3% | .219 |
| Casey Kotchman | 14.5% | .315 |
| Dan Uggla | 14.7% | .290 |


沒有留言:
張貼留言